LitterHeatMap
Litter temperature prediction model & pasteurisation decision support tool
A litter temperature prediction model & pasteurisation decision support tool, developed as part of Poultry CRC project Methods to quantify and inactivate viruses in poultry litter, “LitterHeatMap”, is available by contacting Poultry Hub Australia, poultryhub@une.edu.au
The following sets out the parameters of the tool:
Purpose:
To predict temperatures in chicken broiler litter heaped for pasteurisation & provide user-defined summary temperature data.
Input data:
Timing & duration of heap, ambient temperature data, heap/windrow dimensions, initial moisture content, use of covers, turning of litter.
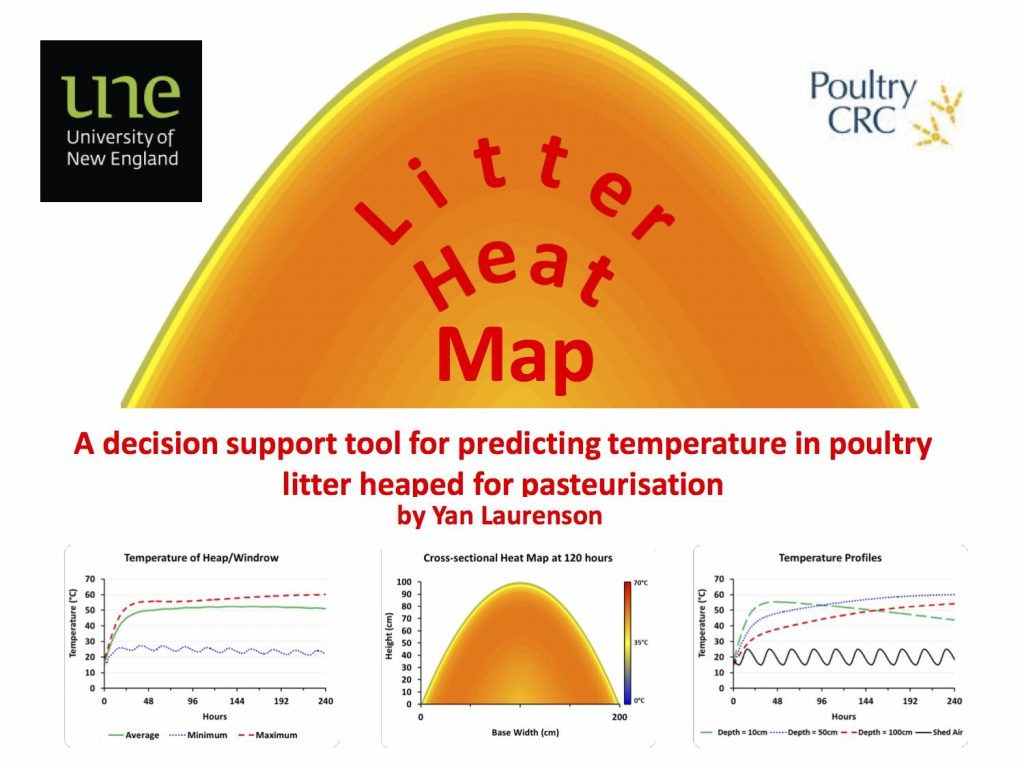
Outputs:
Average, minimum and maximum heap temperatures, proportion of the heap/windrow reaching specified temperatures & durations, a cross sectional heat map of the heap/windrow at a specified time with a table indicating percentage of the heap in different temperature classes, temperature profiles at specified depths.
Instructions:
Please ensure that macros are enabled when prompted. The model comprises 3 visible worksheets in a Microsoft Excel Workbook. Navigation between worksheets is either automatic or by clicking on the relevant tab at the bottom of each page. In the Input, sheet enter the relevant values into the orange coloured cells. Other cells are protected and cannot be altered. Click on the “Run” icon and wait for the model to run. Depending on the size of the run (larger heaps and longer durations take longer to simulate) after a few moments, the results page will open with the model outputs. To compare the effect of varying input values multiple simulations can be run and the outputs saved as a PDF file. The output section contains a summary of the input values for comparison.
Development & background:
The model was developed from a data set comprising 542 temperature profiles over a litter pasteurisation cycle of 6-10 days at various depths in approximately 100 litter heaps subject to various treatments on 8 farms. The data set includes over 90,000 individual temperature recordings. The dataset was empirically modelled using 75% of the data for development & 25% of the data for validation.
Acknowledgements:
The data used to develop the model was collected by Fakhrul Islam & Michael Cressman on projects 06-15, 2.2.3 & the Michael Cressman PhD project funded by the Poultry CRC. Yan Laurenson developed the model in consultation with Steve Walkden-Brown, Mark Dunlop & Fakhrul Islam. Fakhrul Islam & Steve Walkden-Brown collated the data into a single dataset prior to use for model development. This Research was partly conducted within the Poultry CRC, established & supported under the Australian Government’s Cooperative Research Centres Program.
Acknowledgement of use:
When this decision support tool is used both the author (Dr. Y.C.S.M. Laurenson) and the Poultry CRC should be acknowledged.

The Poultry Hub Australia profoundly acknowledges and respects that its foundations, both people and facilities, are established on land rich in the history and traditions of the world’s oldest living culture. PHA values and respects Indigenous knowledge, understanding its importance in our shared history. We acknowledge the strength, resilience, and contributions of the Aboriginal community, we pay our tributes to the Aboriginal Elders – those who guided us in the past, those who lead us today, and those who will enlighten our paths in the future.