Calibration Curve Confidence Calculator
Abductive statistical methods improve the results of calibration curve bioassays
Agricultural scientists sometimes run trials, or experiments, and wonder: “Are the statistical methods developed in the early 20th Century, before computers, still applicable in the early 21st Century?” Such was the case when UNE Poultry researchers Professors Robert Swick, Shubiao Wu, and Natalie Morgan, and their student Anna Nguyen, ran some trials designed to determine the bioavailability of a new dietary zinc source zinc hydroxycholride. They wondered if there was a better analytical method than the ones they’d learned and are routinely applied across practically all of agriculture. While some models were used, Wu raised questions about the appropriateness of these models for the design of the experiment.
Swick and Wu expanded their team with Gene Pesti, an Adjunct Prof at UNE and Professor Emeritus at the University of Georgia, USA, and Lynne Billard, University Professor at the University of Georgia. Pesti’s expertise lies in poultry science and experimental design. Billard is a Past President of the American Statistical Association and International Biometric Society,
and her main area of expertise is in mathematical statistics. Now it is (unfortunately) not usual for poultry scientists to interact with mathematical statisticians. And, then it isn’t usual for mathematical statisticians to have milking cows in rural Queensland as their first job either.
What developed from the team’s discussions was an electronic spreadsheet with an improved “Abductive” method of solving the calibration curve problem (in this case zinc bioavailability); And a refereed journal article written with the hope that both agricultural scientists and mathematical biometricians could understand the appropriate procedures and work together more easily.
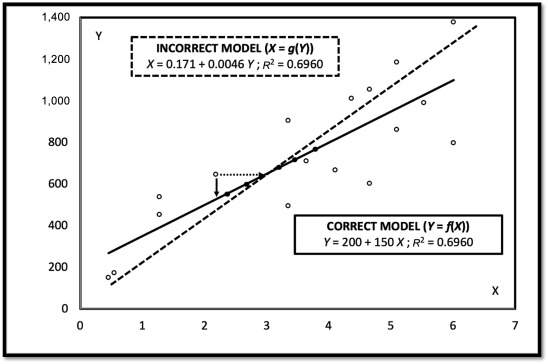
The root of the problem addressed by the team is that scientists are taught to look at calibration curve, or standard curve, problems, in terms of y=f(x). It seems entirely plausible to turn the equation around to x=g(y) and solve their standard curve equations. It seems plausible, but it is statistically incorrect unless there is zero variation in both y and x. . Inverting y=f(x) to get x=g(y) gives very similar results when there is little variation in the standard curve as in most analytical chemistry applications. When there is considerable variation like we find in our agricultural assays with live animals, the error from inverting the equation becomes quite significant. The abductive method helps scientists make more realistic summaries of their experimental results.
The abductive method is based on observation and reasoning. What has confused the calibration curve methodology literature is the way some scientists have approached the problem. They used simulations to show the results of the two methods are not significantly different, at least under some conditions. But it is not important that the methods give similar results. The methods use different equations and the results are always different. With bioassays, the differences are particularly pronounced.
Using tibia zinc deposition as the criteria, one zinc hydroxycholride sample was found to contain 107 mg/kg of zinc. The traditional method of estimating standard errors estimated 16 mg/kg. The abductive calculations showed the standard error of this sample should really be 6 mg/kg. The experimental results were really much more precise than originally thought. The abductive method can also be used to calculate more realistic estimates of experimental power for planning future experiments.
Application of the abductive approach to the calibration curve problem will help scientists from many applied fields make small improvements in their analyses and how they plan their next experiments. Sometimes research makes big advances in one area possible. Other research, like furthering the understanding of the calibration curve problem, helps just a little, but across many disciplines and for many, many practical experiments.
Access the Article
Download the Calibration Curve Confidence Calculator Slides
Download the Calibration Curve Confidence Calculator

The Poultry Hub Australia profoundly acknowledges and respects that its foundations, both people and facilities, are established on land rich in the history and traditions of the world’s oldest living culture. PHA values and respects Indigenous knowledge, understanding its importance in our shared history. We acknowledge the strength, resilience, and contributions of the Aboriginal community, we pay our tributes to the Aboriginal Elders – those who guided us in the past, those who lead us today, and those who will enlighten our paths in the future.